
Automated PowerPoint Generator
I managed the complete overhaul of a media consultancy’s proprietary data processing system and client deliverables.
It resulted in improved visual appeal of client deliverables and an 83% decrease in processing time.

COMPANY OVERVIEW
Research Director Inc. is a media consultancy, specializing in helping radio stations grow their ratings and revenue.

They’re able to scale their services by developing customized software that processes radio ratings, automates data analysis, and creates slide decks with data visualization.
Radio station staff use the company’s deliverables to make better programming decisions and sell more advertising.
PROJECT SUMMARY
The biggest supplier of ratings data will be increasing data releases from 4 times to 13 times per year.
The existing system wouldn’t be able to handle the increased frequency.
There were additional reasons to update the system:
Improve efficiency and reduce errors
Modernize visuals and switch to industry-standard file format
Enhance customer experience
ROLES & RESPONSIBILITIES
It’s a small company, so I wore multiple hats.
I served as Product Manager/Product Owner, Business Analyst, UX Designer, and QA Analyst.
We partnered with an IT consulting company to engineer the system.

TIMELINE & SCOPE
We broke up the project into phases, with each of the later phases allowing us to transfer another client deliverable into the new system.
I was the primary person at my company responsible for this project, and I had other responsibilities, so the project was spread out over several years.
DESK RESEARCH: COMPETITIVE ANALYSIS
We performed a SWOT analysis of our company and our competitors to ensure we weren’t missing any blind spots.
Aggregated key findings about our competition:
INTERNAL RESEARCH: CONTEXTUAL INQUIRY
I met with staff to observe their work processes and gather insights into their challenges and needs.
The company’s operational documentation was lacking, so I created an extensive procedural manual.
This manual became a crucial resource and was updated as procedures changed.

EXTERNAL RESEARCH: USER INTERVIEWS
We met with clients in 3 markets and got into the weeds with radio station account executives to understand what they found valuable, what they weren’t using, and what customizations would be beneficial.
These are a few of the things we learned…

Less Is More
Too many charts or tables on a single page looks cluttered. We want a cleaner look with more white space.

Make Us Noticeable
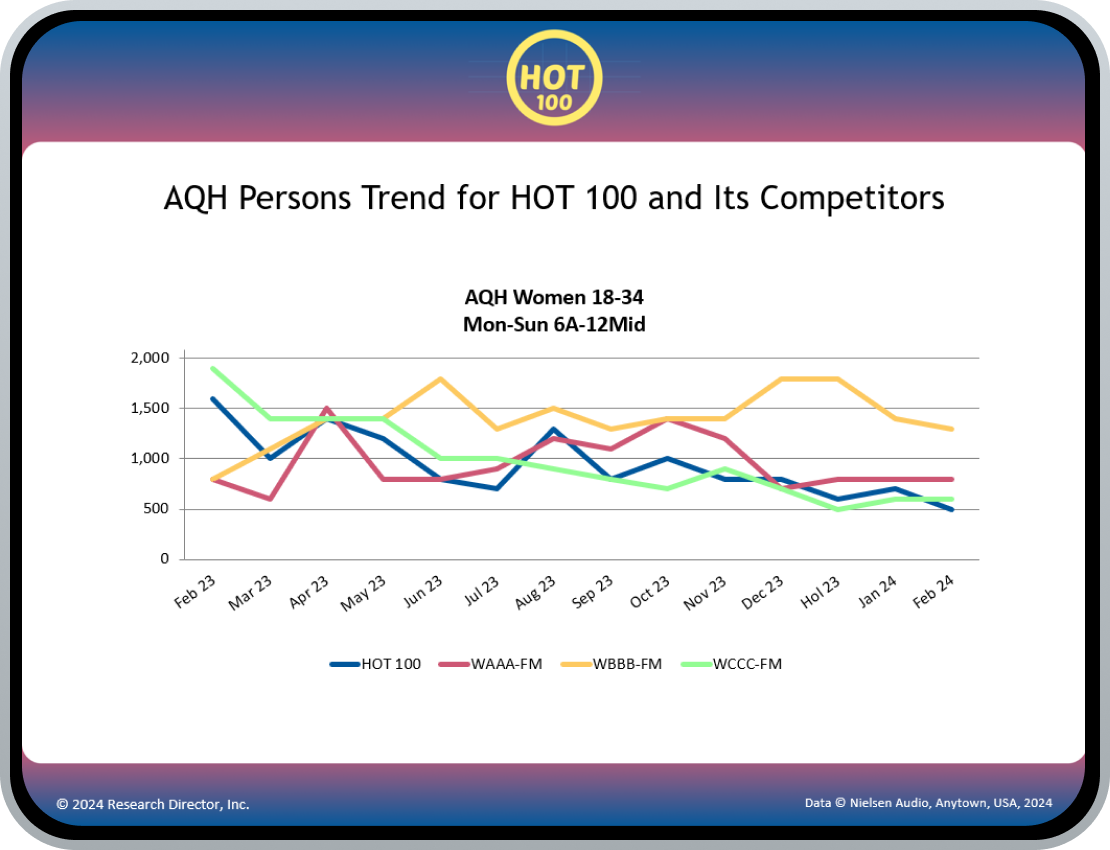
When showing a chart that ranks us against other radio stations, make our station’s bar a contrasting color.

Help Us Educate
Local advertisers aren’t always familiar with radio lingo. A page with terminology would be a great leave-behind.
Organization Is Key
Include a table of contents, but don’t number individual pages so they can be used independently.
PERSONA DEVELOPMENT
Based on what I learned from coworkers and clients, I created personas to represent our internal and external users.
User Persona: Employee
High turnover in this role means procedures must be easy to learn.
Always working from desktop, so intranet site doesn’t need to be responsive.
Operating the current system is repetitive and tedious.
Efficiency is top priority.
User Persona: Client
Account executives don’t necessarily have technical knowledge.
Meetings with potential advertisers can take place anywhere, so deliverables must travel well.
Deliverables must be well-organized and easy to navigate.
Making sales is top priority.
PROCESS FLOW
I created a process flow to visualize a streamlined sequence of critical events, eliminating a lot of kludges that had developed over time.
Reports would run automatically once all prerequisites were met, saving unnecessary steps.
REQUIREMENTS DOCUMENTATION
The requirements needed to communicate a range of functional and non-functional specifications.
-
Detailed specifications were provided for the process of loading radio ratings data into the SQL database.
-
Requirements addressed performance expectations for data processing speed and scalability to accommodate the increased frequency of radio ratings releases.
-
Requirements defined business rules governing customization options and logic for inclusion in PowerPoint decks.
-
Specifications covered user interactions such as inputting data parameters and selecting customization preferences.
-
Criteria for user interface design, navigation, and overall user experience were defined to ensure ease of use for employees.
Every PowerPoint slide created by the system had an intricate set of rules dictating if and how it should be created, based on data conditions and client-specific preferences.
DESIGN
While the engineers worked on the SQL database and ETL process, I started on the design, which consisted of two main components.
Wireframes
Screens for the ASP.NET Web Forms site that employees would use to control the system
Prototypes
PowerPoint decks that the system would create

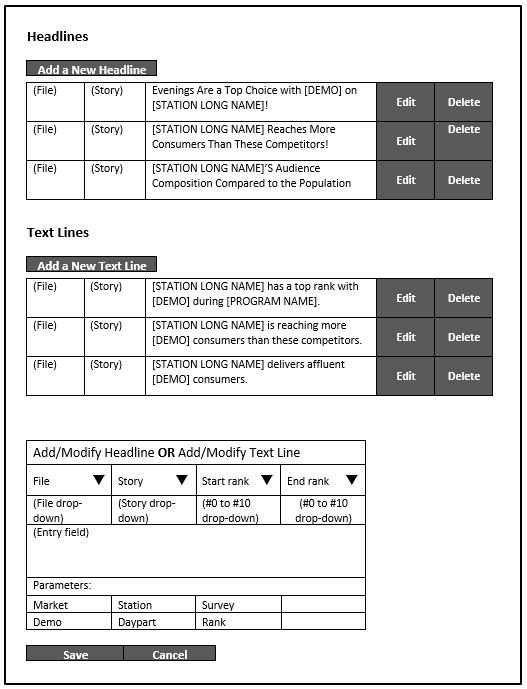
WIREFRAMES
The intranet site would include 16 screens, collectively known as the Admin Tools.
These would only be seen by a few employees, so they didn’t need to be flashy. They just needed to be clear and intuitive.
PROTOTYPES
Based on what we learned during our user interviews, we knew clients were feeling overwhelmed by the size of the existing deliverable and were having a hard time finding what they needed.
The existing system created one very large slide deck, divided into sections.
We made the decision to split the deliverable into a series of smaller files, each tailored to a specific demographic, competitor, or topic.
I created a PowerPoint prototype for each new deliverable.
Each station had customizable branding specifications for fonts, colors, and background design.
The prototypes had to account for all data conditions and edge cases, such as the length of station slogans, market names, etc.
DEVELOPMENT
We followed an Agile framework during development – which lasted much longer than anticipated.
I remotely attended daily stand-ups with the developers to answer questions and make sure their decisions aligned with our business needs.
They had underestimated the complexity of the project, and our timeline was nearly doubled. In their defense, even Microsoft considered the project sophisticated.

TESTING
As features were developed, I led the QA efforts to ensure each component met the requirements.
Functional testing
Performance testing
System testing
Usability testing
The bulk of the effort was functional testing. Complex logic, varying data conditions, and client-specific customizable options necessitated an exceptionally detailed QA plan with thousands of test cases.
I worked closely with the engineering team, leveraging my strong attention to detail and analytical mindset to help pinpoint the root causes of issues.
IMPLEMENTATION
When the system was ready to launch, I trained our staff and helped prepare materials to introduce the new deliverables to over 100 radio stations.
Internal training
Employees operating the system
Client-facing staff
Client communication
Series of email announcements
Live and recorded training webinars
Troubleshooting and adjustments to procedures

OUTCOMES
The new system significantly improved the visual appeal of client deliverables and decreased the company’s processing time by 83%.
2012
2007


-
The rebuild resulted in a significant improvement in processing speed and efficiency, allowing for faster data loading and presentation generation.
-
By eliminating kludges and streamlining workflows, the project led to a notable reduction in errors, thereby decreasing the frequency of reprocessing.
-
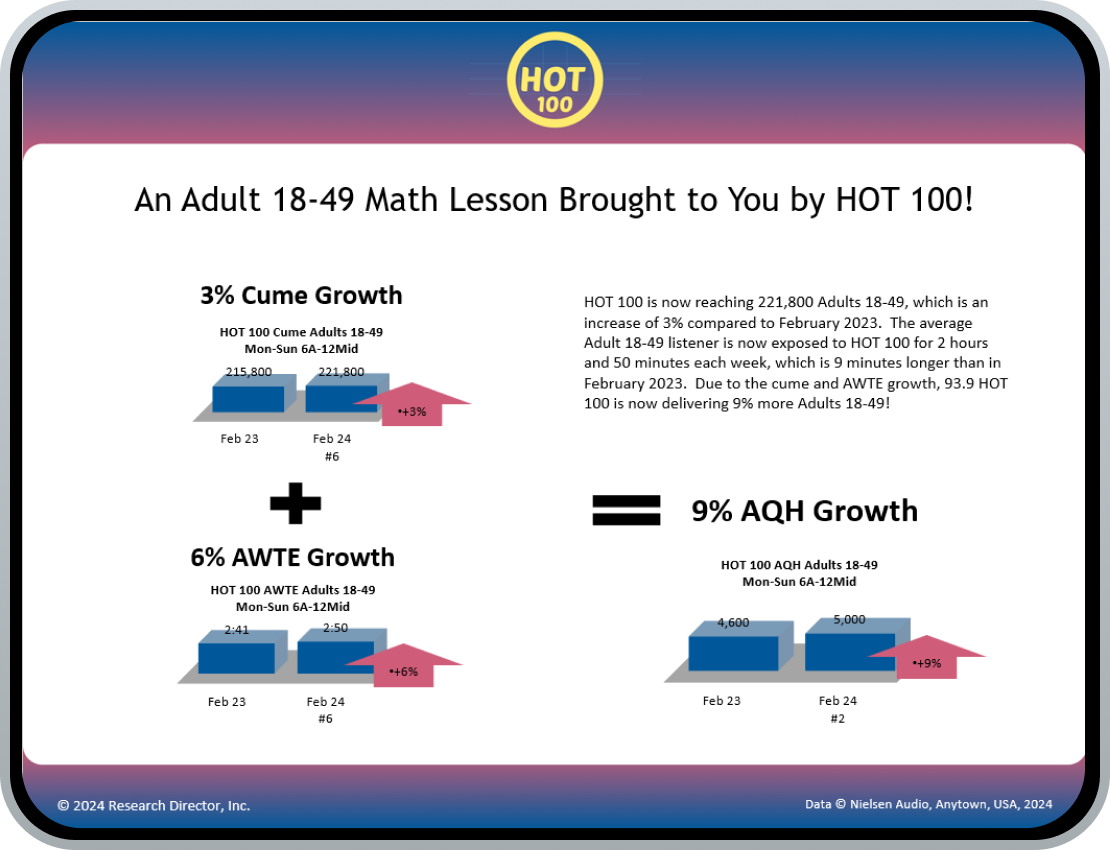
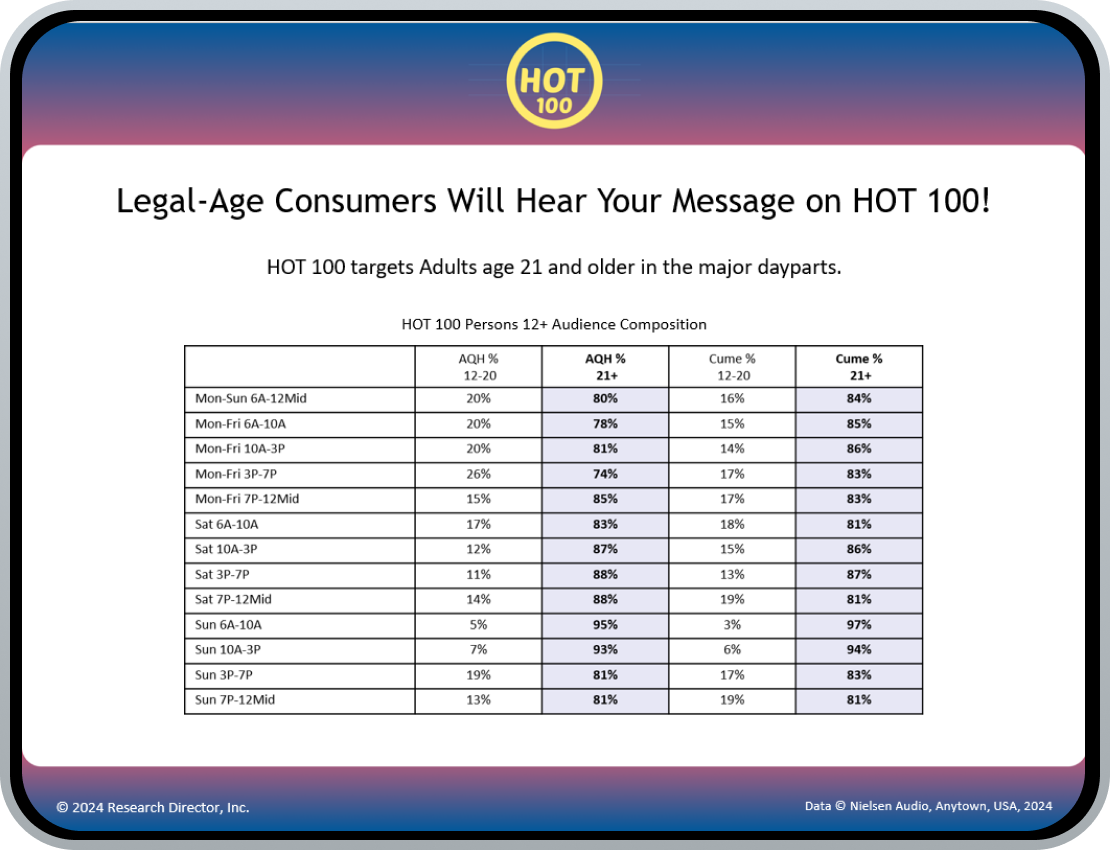
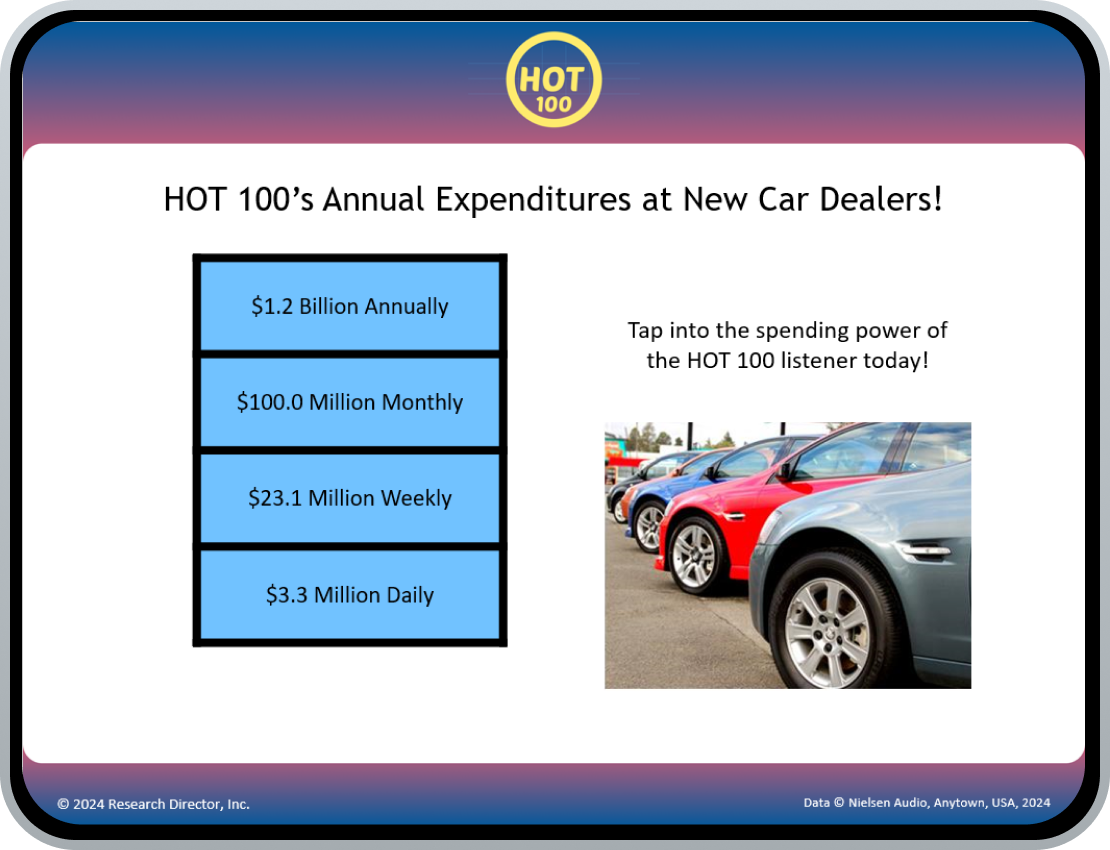
The incorporation of advanced data visualization techniques resulted in more informative and visually appealing PowerPoint decks, providing clients with clearer insights.
-
Clients reported a smoother and more intuitive experience, leading to increased satisfaction, usage, and ROI.
-
Ultimately the project gave the company a competitive edge in the market.
“Due to the comprehensive analysis Anne did during the research and design phases of the project, the system has served as a stable foundation that we’ve relied on for more than a decade with minimal revisions or corrective actions required.”
-Marc Greenspan, Founder & CEO of Research Director, Inc.
LESSONS LEARNED
I learned some important technical best practices that I could apply to future projects.
Consider future internal users who are not familiar with the back end when writing and implementing error messaging.
When populating screens with complex (and slow) queries, load only the necessary content automatically and allow the user to load additional content if needed.
Don’t make the user wait for processes to finish before continuing with an unrelated task
View other case studies: